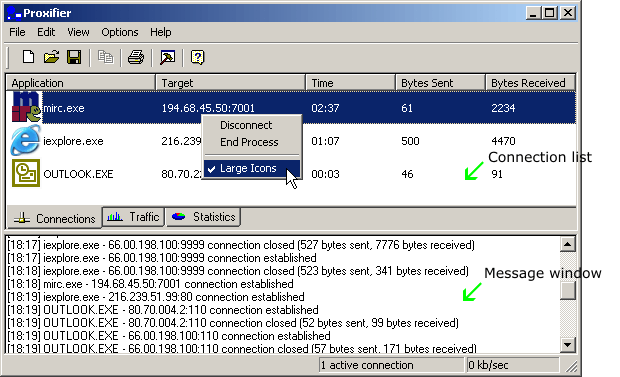
The main Proxifier window looks like this:

It consists of the following main parts:
Message window
In this window Proxifier displays the information about connections, errors,
warnings, etc. in the form of text messages. You can specify the types of messages
you would like to get in the View->Output Level
menu.
To work with the text, right-click the message window and use the context menu.
Connection list
The information about active connections is displayed on this tab. The information
about each connection includes the program name the remote address, time, and
the number of received and sent bytes. You can sort the list by any of these
parameters by just click the corresponding column header.
If you right click on a connection, the context menu will be shown. It contains the following items:
Disconnect - closes selected connections.
End Process - ends process which creates selected connection
Large Icons - check to display large icons, uncheck to display small ones.
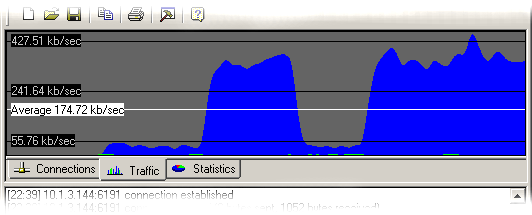
Traffic

The Traffic tab allows you to view the graphic presentation of the data on
the amount of information being transferred. The blue color presents the incoming
traffic, while the green one is the outgoing traffic. The horizontal black lines
indicate the levels of data transfer rate (kilobytes per second). The white
line indicated the average transfer rate for the displayed period of time.
Right-clicking the Traffic tab will open a context menu. Using it, you can copy
or clear the graph and also specify the type of the graph.
Statistics
This tab shows various statistics on the work of Proxifier: the total number
of connections processed by the program, the number of active connections, the
amount of sent and received bytes, the time Proxifier has been working.